1. What's Going On, Really?
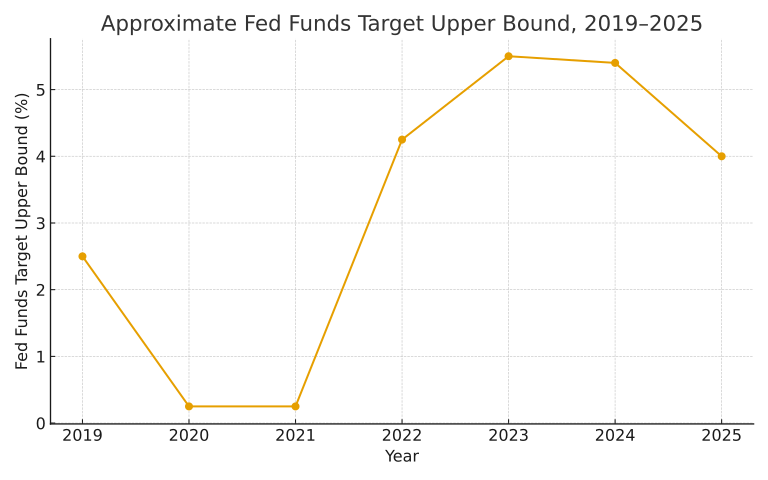
The Federal Reserve has started to edge away from peak rates, but the system is still living in a high-for-longer regime by any historical standard. After taking the federal funds target range to a cycle high of roughly 5.25–5.50%, the Fed has only recently begun cutting in 25 bp steps, bringing the range down to about 3.75–4.00% as of the October 2025 FOMC meeting.
For households and traditional corporates, this shows up as slower credit growth and higher debt service. For the US private credit market and the banking system that funds and intersects with it, the impact is more structural:
-
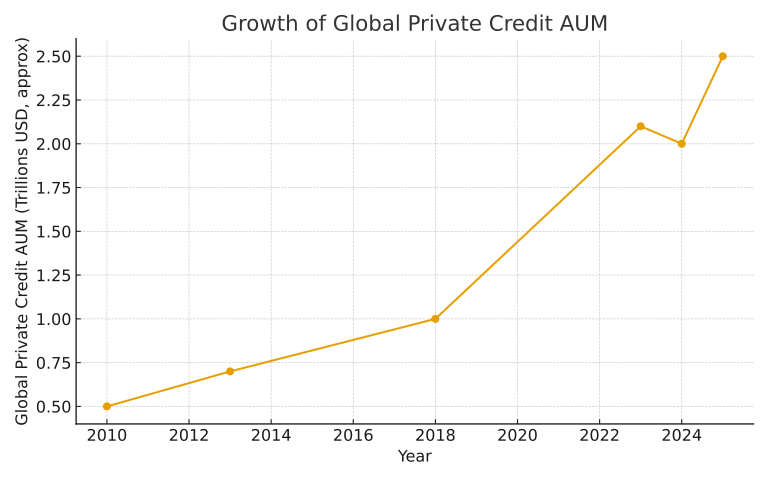
Private credit AUM has ballooned to roughly $3 trillion globally, up from about $2 trillion in 2020 and projected toward $5 trillion by the end of the decade, with North America accounting for the bulk of flows.
-
Loans in this market are predominantly floating-rate, senior secured, and concentrated in leveraged borrowers that migrated away from traditional banks and syndicated loan desks after 2008 and again after 2020.
-
US banks are not “outside” this ecosystem; they provide funding lines, derivatives, subscription facilities and hold exposures to non-bank lenders. New reporting rules show large US banks now disclose over $1.2 trillion of loans to non-deposit financial institutions (NDFIs), of which private credit lenders are a substantial part.
At the same time, the US banking sector is carrying large interest-rate scars from the hiking cycle:
-
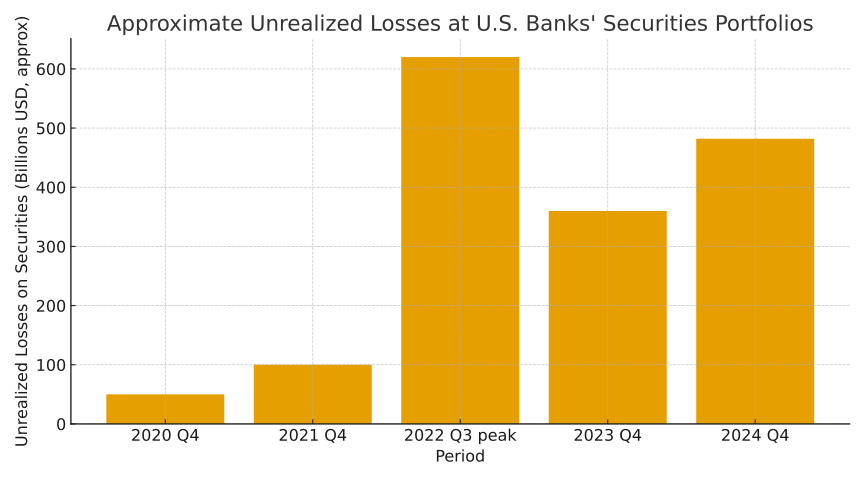
Unrealized losses on securities at FDIC-insured banks were around $480–520 billion at the end of 2024, equivalent to roughly 8–9% of securities’ fair value and near one-fifth of banking-subsidiary equity on average.
-
A growing tail of banks report unrealized losses on investment securities exceeding 50% of CET1 capital.
This article walks through the mechanics linking:
-
Fed policy and persistently high real rates;
-
Stress transmission into the US private credit market;
-
How these stresses feed back into bank liquidity, funding costs and solvency perceptions;
-
Why this combination can still produce a bank liquidity crisis even after the headline panic of 2023 has faded.
2. The Fed’s High-for-Longer Game...
2.1 From emergency easing to restrictive rates
The Fed’s trajectory over the last five years has three distinct phases:
-
2020–2021: Zero rates and QE to stabilize the pandemic shock.
-
2022–2023: Fastest hiking cycle since the Volcker era, taking the federal funds upper bound from 0.25% to 5.50%.
-
Late-2024 to 2025: A shallow cutting cycle, with the target range lowered twice by 25 bp each, to 3.75–4.00%, while inflation remains above target and the labor market softens.
Even after the recent cuts, today’s policy rate is 2–3 percentage points higher than the 2010–2019 post-GFC norm. Mortgage, corporate, and term funding curves have repriced accordingly.
2.2 QT, reserves and the liquidity backdrop
Beyond the policy rate, the Fed has been shrinking its balance sheet, reducing reserves and withdrawing term support:
-
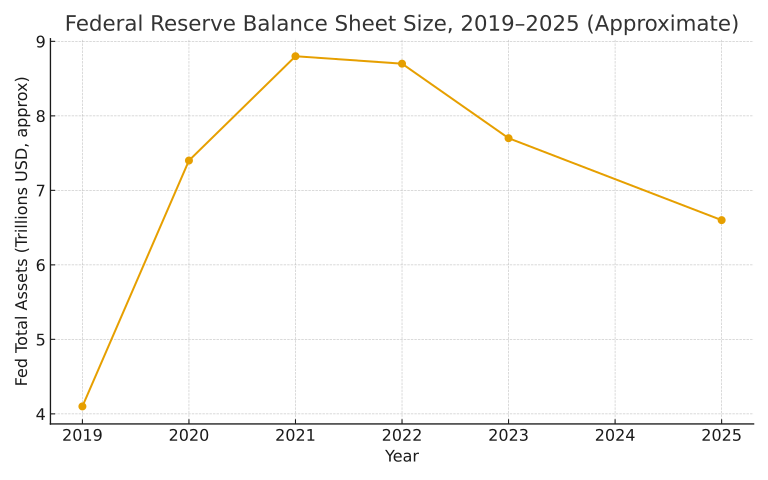
The Fed’s balance sheet has fallen from a $9 trillion peak in 2022 to around $6.7 trillion and is expected to stabilize closer to $6.2 trillion by 2026.
-
Quantitative tightening (QT) plus usage of the Fed’s Overnight Reverse Repo (ON RRP) facility drained system reserves and put pressure on core bank deposits, particularly for institutions that had parked excess liquidity in low-yielding securities.
The combination of higher rates + lower reserves has two direct consequences for banks:
-
Funding is more expensive and more mobile (deposit “flightiness” increases).
-
The opportunity cost of holding low-coupon securities or low-yield loan books rises sharply.
This backdrop is the macro canvas on which the private-credit expansion and bank-liquidity risks are painted.
3. The Private Credit Machine in a High-Rate World
3.1 Size, structure and risk profile
Private credit has moved from niche to core within a decade:
-
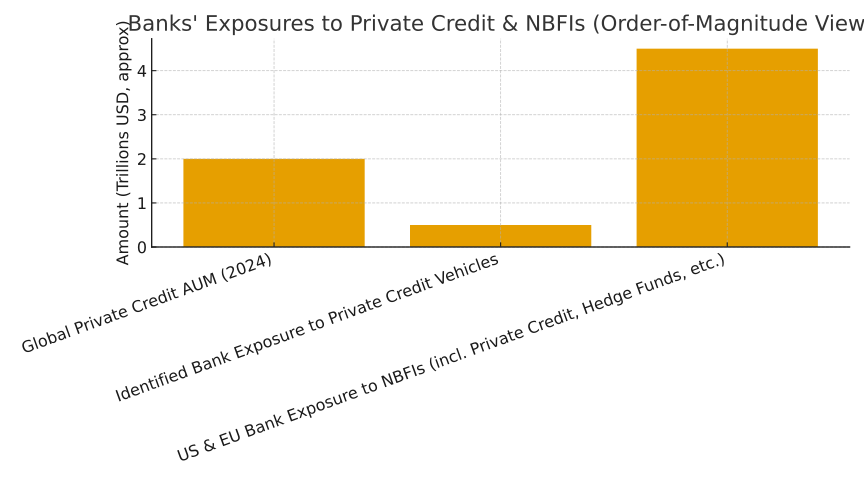
Global private credit AUM has quadrupled over ten years to around $2.1 trillion in 2023, and more recent industry estimates place it nearer $3 trillion by early 2025, with North America representing roughly 70% of capital raised.
-
The sector is now roughly the same order of magnitude as US high-yield bonds and leveraged loans, effectively forming a third pillar of corporate credit.
Key structural features:
-
Floating-rate loans: Most private credit loans are senior secured and priced over benchmarks such as SOFR, with regular resets.
-
Middle-market & sponsor-backed borrowers: Companies often too small, too levered, or too complex for public bond markets.
-
High spreads and tight documentation: Loans carry high coupons and bespoke terms, but often with covenant-light structures in competitive vintages.
In a zero-rate world, floating-rate exposure looked attractive for investors and manageable for borrowers. In a 4–6% front-end world, the same feature becomes a transmission channel for stress.
3.2 Higher rates → higher coupons → weaker coverage
As front-end rates rose 500+ bp from 2022 to 2023, coupons on floating-rate private credit re-priced almost one-for-one:
-
A borrower paying SOFR + 500 bps moved from ~5–6% all-in to 10–11% when SOFR traded above 5%.
-
Even after cuts, many borrowers are still facing high-single-digit to low-double-digit all-in coupons, while revenue growth slows.
The mechanics are straightforward:
-
Interest expense doubles for many leveraged borrowers.
-
EBITDA margins compress as wage and input costs remain sticky.
-
Interest coverage ratios (ICR) (EBITDA / interest) deteriorate from, say, 3–4x to 1.5–2x or lower, particularly in cyclical sectors.
Data from rating agencies show:
-
US private credit default rates rising toward the mid-single digits, with Fitch’s US private credit default rate around 4.5% in early 2025.
Defaults remain below crisis levels, but the trend is clear: pressure is building in a segment that has grown very quickly, with limited transparency.
3.3 NAV pressure, side pockets and liquidity mismatch
Most private credit is held in closed-end funds or vehicles with limited redemption windows. But the liquidity profile is not infinitely patient:
-
Higher rates → lower enterprise values → margin pressure → rising restructurings.
-
Managers respond via amend-and-extend, PIK toggles, and covenant waivers to avoid crystallizing defaults.
-
Over time, this can create a gap between reported NAV and underlying economic value, especially if marks lag.
To manage liquidity, funds increasingly rely on:
-
Subscription lines tied to investors’ commitments;
-
NAV facilities secured by portfolios;
-
Repo and bank credit lines for short-term funding.
This is where the banking system steps directly into the picture.
4. Where Banks and Private Credit Intersect
4.1 Direct exposures to non-banks
Regulatory changes now require large US banks to disclose more detail on lending to non-deposit financial institutions (NDFIs). As of the December 2024 reporting quarter:
-
US banks with >$10 billion of assets reported about $1.2 trillion in loans to NDFIs, which include private credit funds, hedge funds, mortgage REITs and other shadow-bank entities.
Within that pool:
-
A material and rising share is tied, directly or indirectly, to private credit strategies, either as subscription lines, fund-level leverage, or lending to vehicles sponsored by private equity and credit managers.
If higher rates trigger stress in portfolio companies, private credit funds may:
-
Draw more heavily on bank lines to support workouts;
-
Breach covenants on NAV facilities;
-
Seek waivers or refinancings from their bank counterparties.
This turns what looks like “loan-level risk isolated in private funds” into counterparty and credit risk for banks.
4.2 Banks as investors and structurers
Banks also intersect private credit via:
-
Co-lending and club deals with direct lenders;
-
Underwriting and distributing private credit securitizations or structured notes;
-
Investing in interval funds and other semi-liquid vehicles that hold private credit.
These channels create additional mark-to-market and liquidity risks if valuations gap lower or redemptions surge in stress environments.
4.3 Competitive rebound & cyclicality
Interestingly, by early 2025 banks have started regaining ground in some segments, particularly larger LBO financing, as syndicated loans re-emerge and some mega-deal private credit retreats.
This pushback means:
-
Banks are once again loading balance sheets with leveraged corporate exposure.
-
The line between “private credit risk” and “bank balance-sheet risk” gets more blurred, not less.
5. Bank Balance Sheets Under Rate-Shock Stress
5.1 Unrealized losses: the quiet hole in capital
Higher long-term yields have already inflicted substantial damage:
-
As of end-2024, US depository institutions carried around $481 billion in aggregate unrealized losses on securities, equal to ~8.6% of fair value and nearly 20% of aggregate banking-subsidiary equity.
-
In Q4 2024 alone, unrealized losses on held-to-maturity (HTM) and available-for-sale (AFS) portfolios increased by more than $100 billion, with some mid-size banks reporting paper losses ≥ 50% of CET1.
These losses do not fully hit regulatory capital as long as:
-
The bonds are held to maturity;
-
The bank does not need to sell them;
-
Depositors remain confident.
But they reduce flexibility:
-
Securities can’t be liquidated without crystallizing large losses;
-
Collateral values for borrowing against these securities in repo or central bank facilities are constrained;
-
Earnings from low-coupon bonds lag jumping deposit costs, compressing net interest margins.
5.2 Deposits: more expensive, more flighty
On the liability side:
-
Average interest cost on interest-bearing deposits is projected to stay elevated (around 1.5–1.7% in 2024–25) even as policy rates come down, keeping pressure on margins.
-
Research from the New York Fed documents rising deposit “flightiness”: deposits are more likely to move quickly in response to rate differentials or perceived safety concerns, particularly when hikes follow periods of abundant reserves and QE.
Post-SVB, uninsured and corporate deposits are hyper-sensitive to:
-
Headlines about unrealized losses;
-
Social-media narratives;
-
Signals of stress in any asset class linked to a given bank’s lending footprint.
A bank with:
-
Large unrealized losses,
-
A heavy NDFI / private credit exposure book, and
-
A concentrated, uninsured deposit base
is structurally vulnerable to a liquidity event, even with apparently solid capital ratios on paper.
6. How High Rates + Private Credit Stress Can Trigger a Bank Liquidity Crisis
Let’s connect the dots as a sequence of mechanics, not a vague doom story.
Step 1: Fed stays restrictive relative to the real economy
Even after cuts, the real policy rate (nominal rates minus inflation) stays positive:
-
The front end sits around 3.75–4.00%;
-
Inflation drifts near 2–2.5%;
-
Growth slows, profit margins compress, labor markets soften.
For leveraged borrowers in private credit:
-
Coupon burdens remain elevated;
-
Top-line growth slows or stalls;
-
Interest coverage and debt service ratios slide.
This creates a slow-burn credit deterioration rather than a sudden shock.
Step 2: Private credit portfolios re-price under the surface
Some indicators:
-
Private credit default rates tick up toward 4–5%;
-
More loans are restructured via maturity extensions, rate reductions, or PIK interest;
-
Recovery assumptions and collateral values are revised quietly, often without public market price discovery.
NAV marks begin to soften:
-
Funds relying on internal model marks show smaller adjustments;
-
Investors grow wary of opacity and request more information or push back on valuations;
-
New capital raises become slower and more selective.
At the same time, market participants and regulators (including the Fed and IMF) voice growing concern over private credit’s opacity, leverage, and rapid growth.
Jamie Dimon’s warnings about a $2 trillion industry “resembling pre-crisis risk patterns” are not about size alone, but about the combination of rapid expansion, thin transparency and cyclically vulnerable borrowers.
Step 3: Bank exposures to private credit intermediaries get tested
As portfolio companies struggle:
-
Funds draw on subscription lines to support follow-on capital or bridge liquidity.
-
NAV facilities see their collateral ratios deteriorate; banks get calls to re-margin, tighten covenants, or negotiate waivers.
-
Some NDFIs may need to refinance or restructure bank facilities, turning what looked like low-risk, senior, asset-backed lending into higher-risk relationship exposure.
Under mild stress, this is manageable: banks can absorb a gradual uptick in provisioning.
Under more intense stress:
-
Banks are forced to increase loan-loss provisions on NDFI books;
-
Funding lines are capped or pulled;
-
Private credit funds scramble for alternative liquidity, amplifying the shock.
Step 4: Simultaneous mark-to-market pressure on securities and credit
Now overlay that with the securities book:
-
If long yields remain elevated or re-steepen (say, 10y yields pushing higher as markets price persistent deficits and term premium), unrealized losses do not heal quickly.
-
Banks face a double squeeze:
-
Asset side: credit impairments and higher risk-weighted assets;
-
Securities side: large paper losses locking up capital and limiting liquidity options.
-
This combination erodes confidence in:
-
The true economic value of capital;
-
The quality of risk management;
-
The ability of management to absorb another shock.
Step 5: Depositors react faster than regulators
In the post-SVB world, depositors—especially corporates, wealth clients, and tech/PE ecosystems—are primed to move at the first sign of trouble.
Catalysts can include:
-
Media stories about a bank’s large unrealized losses on securities;
-
Disclosures or rumors around outsized private-credit exposures;
-
Ratings actions, analyst downgrades, or social-media narratives.
Given:
-
Elevated deposit flightiness,
-
A large share of uninsured deposits,
-
And a high-beta, rate-sensitive client base,
outflows can accelerate over hours, not weeks.
The bank responds by:
-
Drawing on contingent facilities (FHLB advances, discount window, standing repo).
-
Posting high-quality collateral (USTs, agencies, MBS) at haircuts that crystallize some portion of unrealized losses.
-
Selling securities if necessary, locking in mark-to-market hits to capital.
If the gap between accounting capital and economic capital is wide enough, markets—equity, debt, and depositors—start to question solvency, not just liquidity.
At that point, a liquidity shock becomes a solvency narrative, regardless of underlying fundamentals.
7. Why This Matters Now, Even as Profits Look Fine
FDIC data show that in Q4 2024:
-
US banks generated about $70–67 billion in quarterly net income, with ROA around 1.1%;
-
The number of “problem banks” (by regulatory classification) remains modest, in the mid-60s.
Superficially, the sector looks healthy.
But underneath:
-
Unrealized losses remain large and in some cases growing.
-
Deposit costs are structurally higher than the pre-2022 era.
-
Liquidity buffers are smaller after QT and reserve run-off.
-
Exposures to non-bank financials and private credit have scaled up in the shadows.
This is a classic late-cycle configuration:
-
Earnings are still good;
-
NPLs are still manageable;
-
Market spreads are relatively tight;
-
Yet structural vulnerabilities have increased.
When cycles turn, the system rarely breaks at the aggregate level first; it breaks at the interfaces:
-
banks ↔ private credit;
-
deposits ↔ market funding;
-
accounting capital ↔ economic capital;
-
reported NAV ↔ true recovery values.
8. Policy Response Scenarios
If Fed policy and private credit stress eventually interact to trigger a bank liquidity problem, the response will likely involve variations of tools already seen in 2023–2024:
-
Liquidity facilities 2.0
-
A new or extended term funding facility (BTFP-like), allowing banks to borrow against high-quality securities at par or at favorable haircuts, buying time for rates to normalize and losses to amortize.
-
-
Adjustments to QT
-
Slowing or pausing balance-sheet runoff to stabilize reserves and interbank liquidity.
-
-
Moral suasion and supervisory pressure
-
Quietly pushing banks to term out funding, reduce concentration to NDFIs and hedge rate risk more aggressively.
-
-
Macroprudential focus on private credit
-
Enhanced data collection, stress testing and disclosure requirements for private credit managers;
-
Indirect regulation via the banking system (capital charges for certain exposures, large exposure limits, etc.).
-
However, none of these tools are costless:
-
Supporting banks against rate risk while keeping policy restrictive for inflation creates political and distributional tensions.
-
Tightening the screws on private credit too aggressively risks choking off a now-important credit channel for SMEs and leveraged firms.
-
Allowing rates to fall too quickly risks re-inflating asset bubbles and weakening the nominal anchor.
This is why the “high for longer” regime is inherently unstable: policymakers are balancing inflation control against a banking system still carrying the scars of the prior hiking shock, now tightly coupled to a leveraged, opaque private credit complex.
9. Strategic Takeaways
From a macro-analyst standpoint, the key conclusions are:
-
The Fed is no longer the only protagonist.
The locus of fragility has shifted to the interaction between private credit and bank balance sheets, not just traditional mortgages or consumer credit.
-
High rates have not finished working through the system.
The interest-rate shock is still propagating through floating-rate corporate loans, NAV facilities, and bank–NBFI linkages.
-
Unrealized losses are not “just accounting.”
As long as deposit flight risk is real, large unhedged securities books remain a potential trigger for liquidity stress.
-
Private credit is both a buffer and a conduit for stress.
It has absorbed risk that might otherwise sit on bank balance sheets, but its funding and derivative channels tie it back to banks in ways that can become destabilizing under stress.
-
A future US bank liquidity crisis, if it comes, is more likely to be “slow-burn + sudden snap,”
starting with creeping private-credit losses and valuation doubts, then snapping when depositors and markets lose patience with banks perceived as overexposed or under-hedged.
In short:
-
The era of pain-free scaling of private credit under free money is over.
-
The Fed’s high-rate regime has exposed the hidden fault lines across shadow credit and regulated banking.
-
Whether this eventually crystallizes into a systemic liquidity crisis will depend less on one FOMC meeting, and more on how quickly banks and regulators move to map, price and contain the risks already embedded in the system.

