ZTRADER PRIMER 01 | The Market Is a System
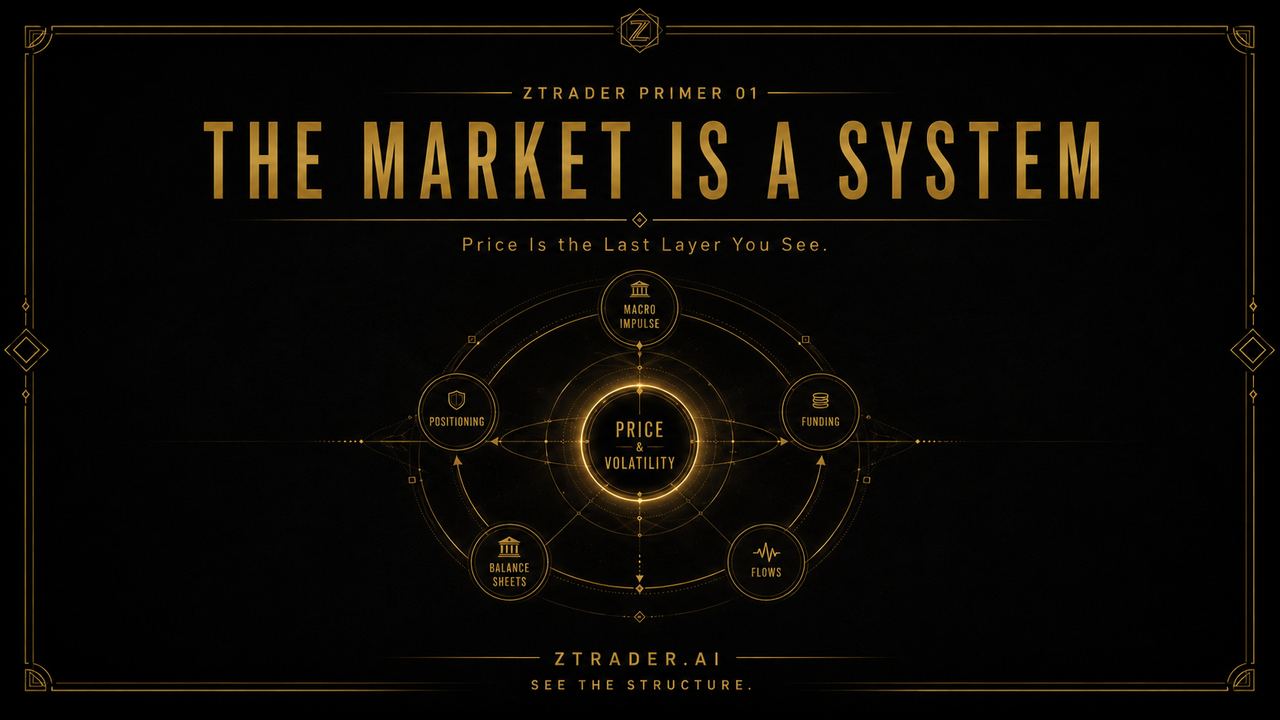
Markets are not a collection of isolated assets. They are a network of funding, balance sheets, collateral, positioning, and risk transfer.
Most people first encounter financial markets as a screen filled with separate prices.
Stocks rise because companies are doing well.
Bond prices fall because interest rates are rising.
Gold rallies because investors are afraid.
The dollar strengthens because the US economy is strong.
Each explanation can be true.
Each can also be dangerously incomplete.
Stocks, bonds, currencies, commodities, credit, and volatility do not operate as separate machines. They are different surfaces of the same financial system.
A change in one part of that system rarely affects only one asset. It moves through a transmission chain.
Policy changes the cost of money.
The cost of money changes financing conditions.
Financing conditions reshape balance sheets.
Balance-sheet constraints alter positioning.
Positioning, liquidity, and expectations finally appear in price.
The market is not merely trading the news.
It is trading the path through which the news enters the system.
⸻
The One-Sentence Answer
The market is a transmission network that converts policy, growth, inflation, liquidity, and risk appetite into asset prices.
Instead of asking:
Is this news bullish or bearish for stocks?
Ask:
Which balance sheet is affected first, what flow follows, and how does that pressure reach the final asset price?
The first question searches for a label.
The second searches for structure.
That distinction is the foundation of serious market analysis.
⸻
01 | The Five Layers of the Market
The financial system can be simplified into five connected layers:
POLICY
↓
FUNDING
↓
BALANCE SHEETS
↓
POSITIONING
↓
PRICE
Price is the most visible layer.
It is also the last one.
What appears to be a sudden market move is often the delayed expression of a process that began much deeper inside the system.
⸻
Layer One: Policy
Policy establishes the system’s operating constraints.
This layer includes:
* Central-bank interest rates
* Fiscal spending
* Tax policy
* Financial regulation
* Government debt issuance
* Liquidity facilities
* Currency intervention
Policy does not directly order an asset to rise or fall.
It changes the environment in which capital operates.
A rate increase raises short-term funding costs. That may reduce leverage, weaken long-duration valuations, increase corporate refinancing costs, tighten credit standards, and force vulnerable positions to unwind.
The visible price move comes later.
Policy is therefore not the trade itself.
It is the first alteration to the architecture surrounding the trade.
⸻
Layer Two: Funding
Funding determines where capital comes from and how much it costs to maintain a position.
Every trade has a financing layer behind it.
Banks need deposits and wholesale funding.
Hedge funds need leverage.
Companies need debt refinancing.
Dealers need balance-sheet capacity.
Property investors need mortgages.
Governments need buyers for new bond issuance.
When funding costs rise, the system does not merely become slightly less profitable.
Some positions stop being viable.
Consider a leveraged relative-value trade built on cheap financing. If the funding cost rises above the expected return, the position must be reduced or closed.
That sale lowers the asset price.
A lower asset price weakens collateral.
Weaker collateral reduces borrowing capacity.
Reduced borrowing capacity forces additional selling.
Higher Funding Cost
→ Lower Leverage
→ Forced De-risking
→ Lower Asset Prices
→ Weaker Collateral
→ Further De-risking
Many market collapses appear sudden only because the financing structure remained invisible until it failed.
⸻
Layer Three: Balance Sheets
Financial markets are governed by balance sheets more than opinions.
Every participant faces limits on what it can buy, hold, finance, or absorb.
Banks are constrained by capital requirements and risk weights.
Dealers are constrained by inventory, regulation, and available balance-sheet capacity.
Funds are constrained by volatility targets, drawdown limits, redemptions, and margin.
Companies are constrained by cash flow and debt maturities.
Households are constrained by income, borrowing costs, and access to credit.
As a result, market participants are not always expressing a view about fair value.
They may simply be responding to a constraint.
A fund can sell equities without becoming bearish on equities. Losses elsewhere may have pushed its total risk above the permitted limit.
A bank can reduce lending without forecasting a recession. Capital pressure may require it to shrink its balance sheet.
A central bank can sell foreign-exchange reserves without holding a directional view on the dollar. It may be defending its currency or meeting external liabilities.
Price action therefore cannot be understood only through beliefs.
It must also be interpreted through forced behavior.
The useful question is not merely:
What does the market believe?
It is:
Who is being forced to do what?
Chart 01 | The Market Transmission System

┌───────────────────────────────────────┐
│ POLICY │
│ Rates · Fiscal · Regulation · Supply │
└──────────────────┬────────────────────┘
↓
┌───────────────────────────────────────┐
│ FUNDING │
│ Cost of Capital · Credit · Repo │
└──────────────────┬────────────────────┘
↓
┌───────────────────────────────────────┐
│ BALANCE SHEETS │
│ Banks · Dealers · Funds · Companies │
└──────────────────┬────────────────────┘
↓
┌───────────────────────────────────────┐
│ POSITIONING │
│ Leverage · Hedging · Crowding │
└──────────────────┬────────────────────┘
↓
┌───────────────────────────────────────┐
│ PRICE │
│ Equities · Bonds · FX · Commodities │
└───────────────────────────────────────┘
Chart caption: Price is the final expression of a deeper financial process.
⸻
Layer Four: Positioning
Markets are not moved by opinions alone.
They move through the difference between a new outcome and the positions already held before it arrives.
If everyone is bullish and already fully invested, additional good news may produce little upside.
If investors are deeply bearish but have already sold, a result that is merely less bad than feared can trigger a violent rally.
A more useful representation of price movement is:
Price Move = Change in Fundamentals × Existing Positioning × Market Liquidity × Time Horizon
The same economic release can produce opposite reactions under different positioning regimes.
A strong inflation report may initially push bond yields higher.
But if investors already hold an extreme short position in bonds, the move may quickly reverse as traders take profits or cover risk.
The market is not ignoring the data.
It is pricing the data relative to expectations, positioning, and available liquidity.
⸻
Layer Five: Price
Price is the final collision point of multiple forces.
It reflects:
* Fundamental expectations
* Policy expectations
* Liquidity conditions
* Risk premia
* Positioning
* Forced transactions
* Discounted future outcomes
Price is not always correct.
But it is always expressing some combination of constraints.
An asset rally does not necessarily indicate improving fundamentals.
It may reflect short covering.
It may reflect easier liquidity.
It may be driven by volatility-sensitive strategies increasing exposure.
It may occur because the marginal buyer has become more urgent than the marginal seller.
The purpose of analysis is not to praise or condemn the price.
It is to identify which part of the system the price is currently expressing.
⸻
02 | Why Different Assets Move Together
Assets often move together because they share the same underlying driver.
Consider a rise in real interest rates.
It can simultaneously affect:
* Long-duration equity valuations
* The opportunity cost of holding gold
* Demand for the US dollar
* Emerging-market financing conditions
* Property valuations
* High-yield refinancing risk
On the surface, several unrelated markets are moving at once.
Underneath, they may all be responding to one system variable.
Higher Real Yields
├── Higher Discount Rates
├── Stronger Dollar Pressure
├── Higher Cost of Holding Gold
├── Tighter Global Funding
└── Lower Long-Duration Valuations
This is the foundation of cross-asset analysis.
Cross-asset analysis does not mean placing more charts on the screen.
It means finding the common force behind different prices.
Chart 02 | One Variable, Multiple Asset Expressions

HIGHER REAL YIELDS
│
┌────────────────┼────────────────┐
↓ ↓ ↓
Growth Equities Gold USD
↓ ↓ ↑
Valuation Pressure Higher Carry Funding Demand
│ Cost │
└───────────────┬─────────────────┘
↓
Tighter Financial Conditions
03 | The System Is Nonlinear
Market transmission is not mechanically proportional.
A ten-basis-point increase in yields does not produce the same response in every environment.
When leverage is low, liquidity is deep, and positioning is balanced, the system can absorb a meaningful shock.
When leverage is high, liquidity is thin, and the trade is crowded, a small trigger may cause a major repricing.
Small Trigger
+ High Leverage
+ Crowded Positioning
+ Low Liquidity
= Large Price Move
The size of a market event is therefore not determined only by the size of the news.
It depends on the fragility of the system before the news arrives.
The headline is often only the trigger.
The existing structure determines whether the result is a minor adjustment or a cascade.
A match is not dangerous by itself.
Its significance depends on whether the room is already full of gas.
⸻
04 | Feedback Loops
Financial markets contain feedback mechanisms that can amplify both declines and rallies.
During a decline:
Price Falls
→ Collateral Weakens
→ Margin Pressure Rises
→ Forced Selling Increases
→ Price Falls Further
A lower asset price reduces the value of collateral.
Weaker collateral limits borrowing capacity.
Reduced borrowing capacity forces investors to cut positions.
Those sales lower the price again.
The process can continue even without additional bad news.
The same mechanism can run in reverse.
Higher asset prices strengthen collateral.
Volatility declines.
Risk budgets expand.
Systematic and leveraged participants add exposure.
New demand pushes prices higher.
A market trend therefore does not always indicate that the underlying economy is improving or deteriorating at the same speed.
Part of the move may be generated by the financial system reinforcing itself.
This is why markets can remain detached from conventional valuation measures and then reprice with extraordinary speed.
⸻
05 | What Traders Commonly Get Wrong
Mistake One: Treating Every Asset as an Independent Story
Technology stocks, gold, Bitcoin, emerging-market currencies, and high-yield credit appear to belong to different categories.
Yet they may all be responding to the same changes in real rates, dollar liquidity, leverage, or risk appetite.
A single-asset explanation can mistake a system-wide move for an asset-specific event.
⸻
Mistake Two: Assuming a Rising Price Means Improving Fundamentals
Prices can rise because of short covering, passive inflows, option hedging, dealer positioning, or expanding liquidity.
Price contains information.
It does not come with an explanation.
The analyst must reconstruct the mechanism.
⸻
Mistake Three: Believing a Correct Macro View Guarantees Profit
A correct economic forecast can still produce a losing trade.
You may correctly forecast slower growth but buy bonds after recession risk has already been fully priced.
You may correctly expect inflation to decline but ignore rising government debt supply and term premium.
You may correctly expect a weaker dollar but express the view through a currency with even worse domestic financing conditions.
Direction is only one component of a trade.
Instrument selection, timing, positioning, carry, convexity, and invalidation matter just as much.
⸻
06 | How to Read the System
A useful daily market process should begin with the system state, not the loudest headline.
Policy
Is monetary policy tightening, pausing, or easing?
Is fiscal policy adding demand or withdrawing support?
Is government debt issuance changing the supply balance?
Funding
Are short-term financing costs rising?
Are credit conditions tightening?
Are banks and dealers willing to expand their balance sheets?
Balance Sheets
Who is adding risk?
Who is being forced to reduce it?
Which sector contains the most leverage or refinancing pressure?
Positioning
What is the dominant consensus?
Is the trade crowded?
Has the market already priced the bad news?
Price
Which assets confirm the same message?
Where are cross-asset signals diverging?
Is the market pricing growth, inflation, policy, liquidity, or a positioning unwind?
Chart 03 | The Daily Market System Dashboard

07 | From System View to Trade
System thinking is not designed to make analysis more complicated.
It is designed to prevent incorrect attribution.
A complete trade thesis should contain five steps:
Observation
→ Transmission
→ Asset Impact
→ Trade Expression
→ Invalidation
Consider a simple example.
Observation
Real yields are rising.
Transmission
Discount rates increase. Dollar funding conditions tighten. Long-duration assets face valuation pressure.
Asset Impact
Growth equities become more vulnerable. Gold faces a higher opportunity cost. Emerging-market financing conditions weaken.
Trade Expression
Select the most direct and liquid instrument in which the adjustment is not already fully priced.
Invalidation
The thesis weakens if real yields reverse, the dollar falls persistently, or risk assets continue strengthening despite tighter financial conditions.
A trade should not begin with:
I think this asset will go up.
It should begin with a transmission chain that can be observed, tested, and invalidated.
⸻
08 | The Core Principle
One of the most dangerous analytical errors is treating the outcome as the cause.
A rising price is not the cause.
A stronger dollar is not the cause.
Higher volatility is not the cause.
Wider credit spreads are not the cause.
They are traces left by changes elsewhere in the system.
The task is to work backward from the trace and identify the structure that produced it.
Do not chase the move.
Trace the transmission.
Once markets are viewed as a system, individual assets stop looking like disconnected charts.
The bond market describes the price of time and capital.
The currency market reveals changes in global funding pressure.
Credit shows where balance sheets are becoming fragile.
Volatility measures the price of transferring risk.
Equities show what investors are willing to pay for future cash flows.
These markets are not speaking different languages.
They are describing different parts of the same machine.
⸻
Primer Card 01
The Market Is a System
1. What changed?
Was the initial shift in policy, growth, inflation, funding conditions, or risk appetite?
2. Who is affected first?
Banks, companies, households, governments, dealers, or leveraged funds?
3. What is the transmission path?
How does the change move from funding into balance sheets, positioning, and price?
4. Which assets should confirm it?
Do rates, currencies, credit, equities, commodities, and volatility tell a consistent story?
5. What invalidates the thesis?
Which variable would prove that the expected transmission is no longer taking place?
⸻
Final Takeaway
The market is not a screen full of prices. It is a network of constraints.
Price is only the surface.
What drives markets is the movement of capital, the cost of financing, the ability of balance sheets to absorb risk, and the point at which investors become forced buyers or sellers.
Before trading an asset, identify its position inside the system.
You are never trading only a stock, a bond, gold, oil, or the dollar.
You are trading a change moving through the financial architecture.
⸻
ZTRADER PRIMER 01
The Market Is a System
See the Structure Before You Trade the Move.